Average Rate Level - Duplicating Parallelogram method on paper

I'll just come out and say it. I'm embarrassed. I've done the parallelogram method for so long that I can get the average rate levels in my head by picturing the parallelogram but I can't put it together on a spreadsheet when the uniform writing of premium assumption is broken.
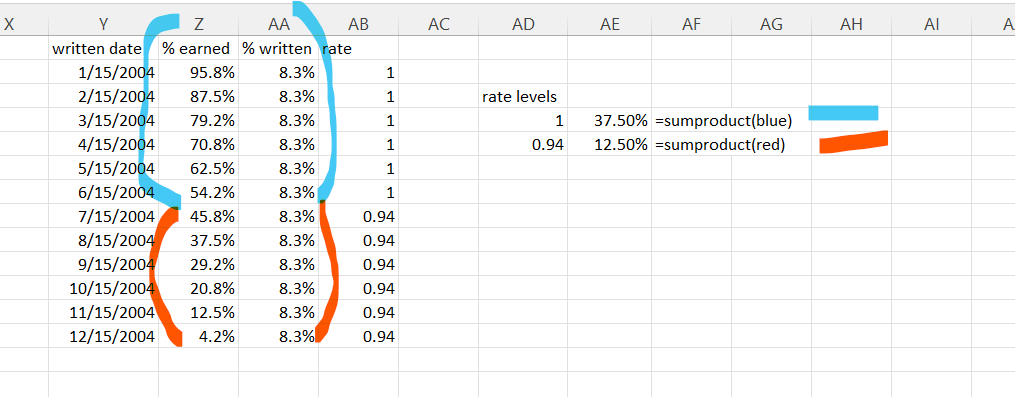
In the attached, I'm trying to duplicate the areas implied by the parallelogram method (.125 and .875), by taking % of premium written by month and multiplying by % earned in that cy. What am I assuming wrong that won't lead to the correct weight being calculated for the first half the year? (It should be .875, but its coming out as .375. Should I be looking at this another way?
Thanks,
Cj
Comments
Was this based on an exam problem? It looks like there was a rate change on 7/15 of negative 6% and that the policies are annual. I think the rate change would need to be 7/1 to get areas of 0.875 in the upper portion and 0.125 in the lower portion of the square for that year. Here's how I did it:
P.S. No need to feel embarrassed. It is definitely confusing if you're used to doing all the calculations geometrically. I think you are still allowed scrap paper and a pencil, right? So you can still do it the old way if necessary.